Make UI more intuitive and more consistent: collapsed view
I find the collapsed view harder to use that it should be. The information is not grouped as well as it could be and the rate graph often makes it hard for me to read the text on the right size of the window.
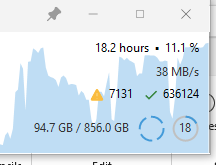
The screen capture seems to show more contrast than when I am looking at the full screen.
Collapsed View
Rate Graph
Make it easier to read text in collapsed view. I find that the graph often makes it hard for me to read the text when the blue graph is covering it. Maybe lighten the graph color, or use a different color that has more contrast with the text. (The next suggestion also addresses the visibility issue.
Arrangement of information
I would suggest experimenting with a different arrangement that groups like items on the same line and puts the important information closer to the top so as to not be covered by the rate graph as often. Here is an example
Line 1: operation information
Jobs icon? At the left of the first line and give it a tool tip

the operation such as verify
Pause and stop buttons at the end of the first line
Line 2: Progress - time based
Add a progress bar showing elapsed time and projected time to completion and percentage complete. This makes progress very obvious.

Line 3: details
1022/15847 files 32.4/88.6MB 32MB/s Average <errors> <circles>
Line 4: file being copied, deleted or verified (source)
If running multi-threaded then start the line with 1 of N to indicate that there are multiple files in progress concurrently
Line 5 is the target file if there is one
Note: with this layout the graph is covering less of the important information most of the time
Please authenticate to join the conversation.
In Review
TeraCopy
Feature
10 months ago

julie777
Subscribe to post
Get notified by email when there are changes.
In Review
TeraCopy
Feature
10 months ago
julie777
Subscribe to post
Get notified by email when there are changes.